Inside the Datrato workspace
How customizable and powerful the reports become, from saved searches to statistical analysis.
Search and requests
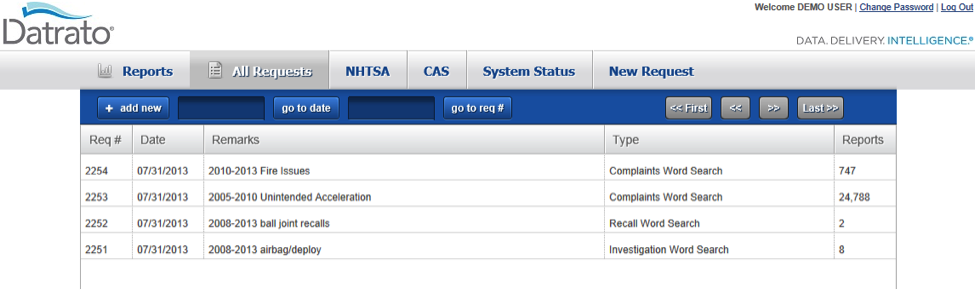
Request Screen
- All searches performed are stored automatically and shown on a dashboard.
- Navigate past searches, review reports, or run additional actions (deeper keyword searches, extra sort parameters).
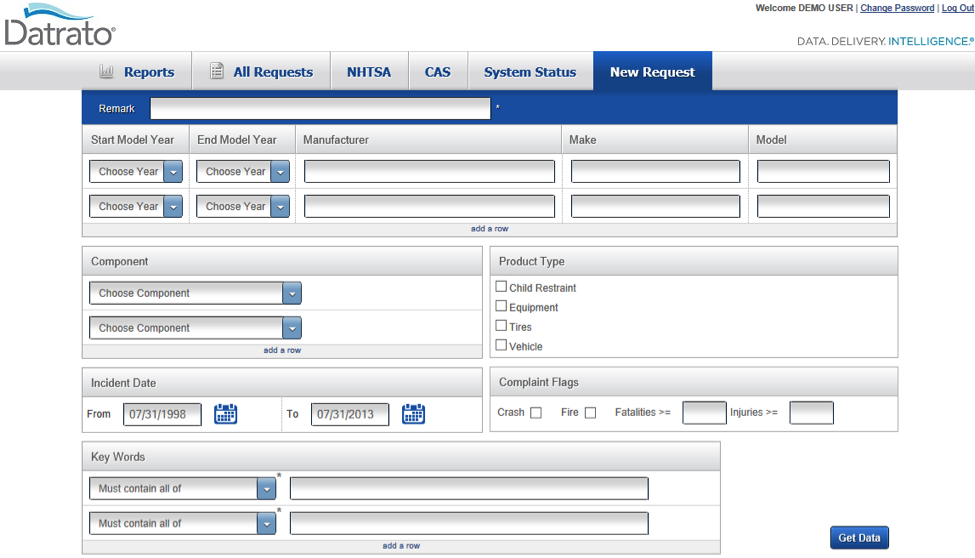
Search Screen
- Enter as much or as little information as you need, then click Get Data.
- Results return instantly as a detailed report, with highlighted keywords for quick review.
- Similar screens for Recalls, Investigations, Technical Service Bulletins, and Center for Auto Safety.
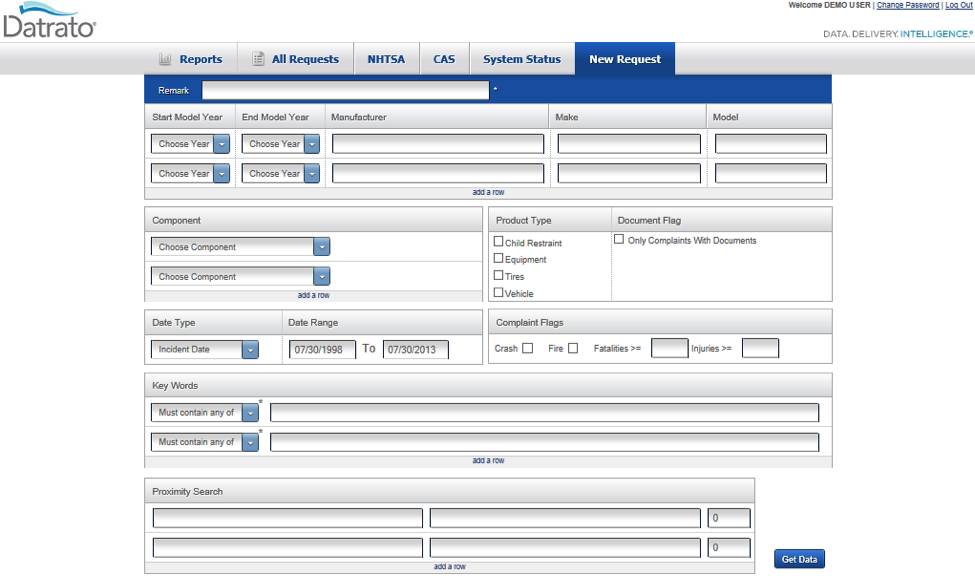
Advanced Screen Search
- Proximity search finds complaints where two or more terms appear within a set number of words (e.g. ‘inadvertent’ or ‘accidental’ within 5 words of ‘deploy’).
- Narrow results to complaints with attached documents.
- Available for NHTSA Complaints.
Statistical reports
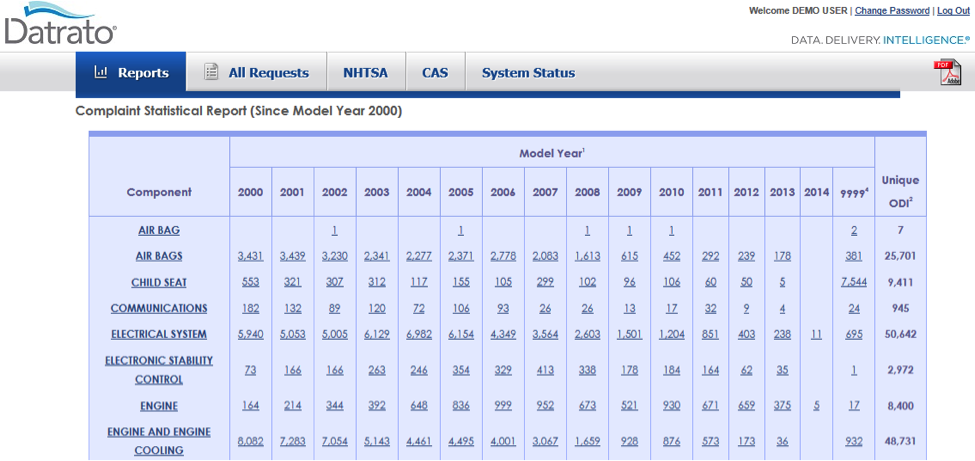
Statistical Tabular Report
- Drill down by manufacturer, then make, model, and finally to the detailed report.
- Available for Complaints, Recalls, and Investigations.
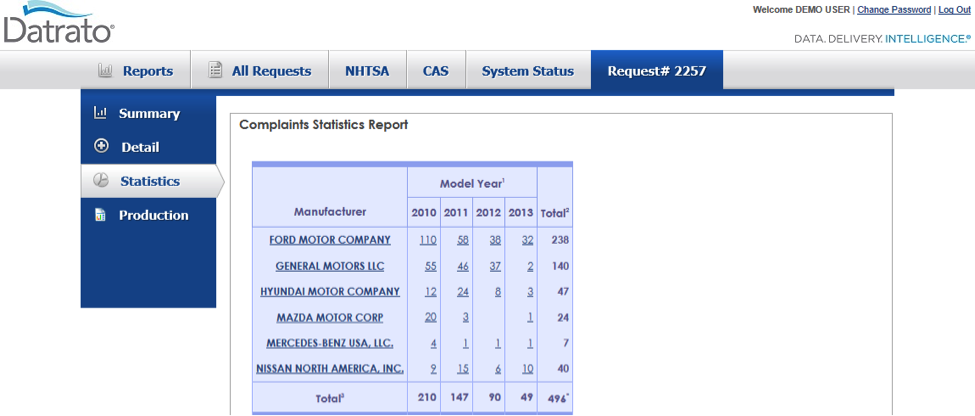
Report for Individual Search
- Statistical tabular report of how results are distributed across manufacturers and model years.
- Drill down to component, make, model, and finally to a detailed report.
- Similar reports for Investigations and Complaints.
Chart reports
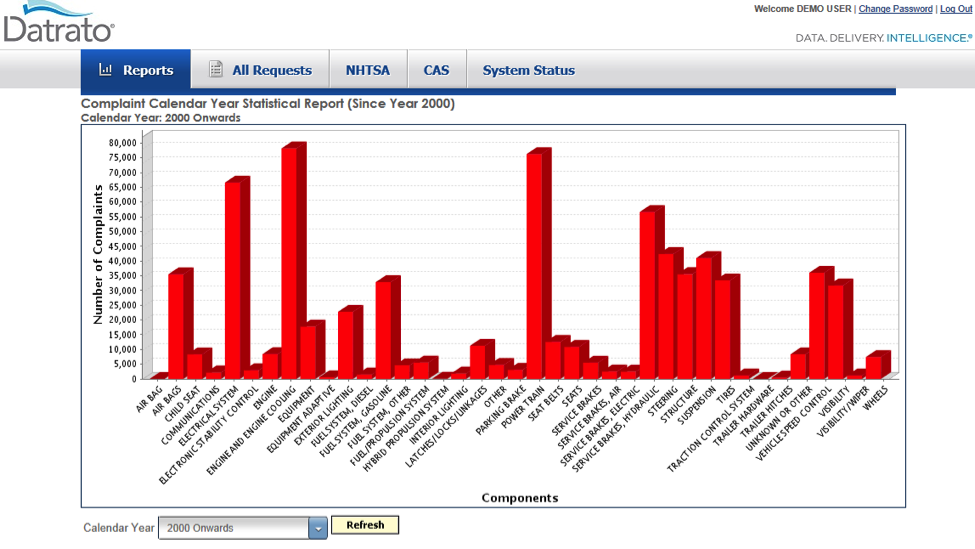
Complaints vs. Components
- View data for any specific model year, or for all model years.
- Available for Complaints, Recalls, and Investigations.
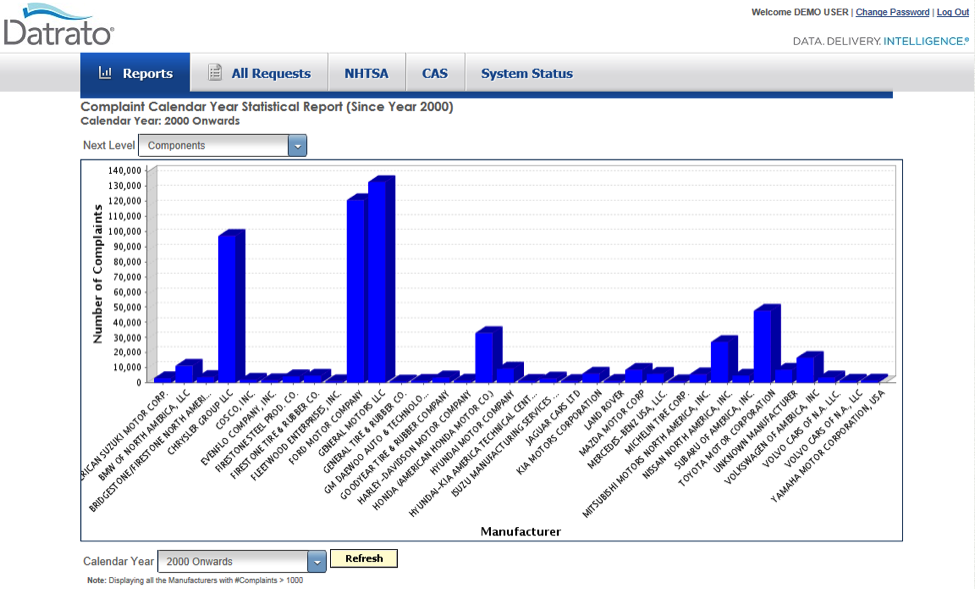
Complaints vs. Manufacturers
- Drill down to manufacturer, make, model, and finally to a detailed report.
- Available for Complaints, Recalls, and Investigations.
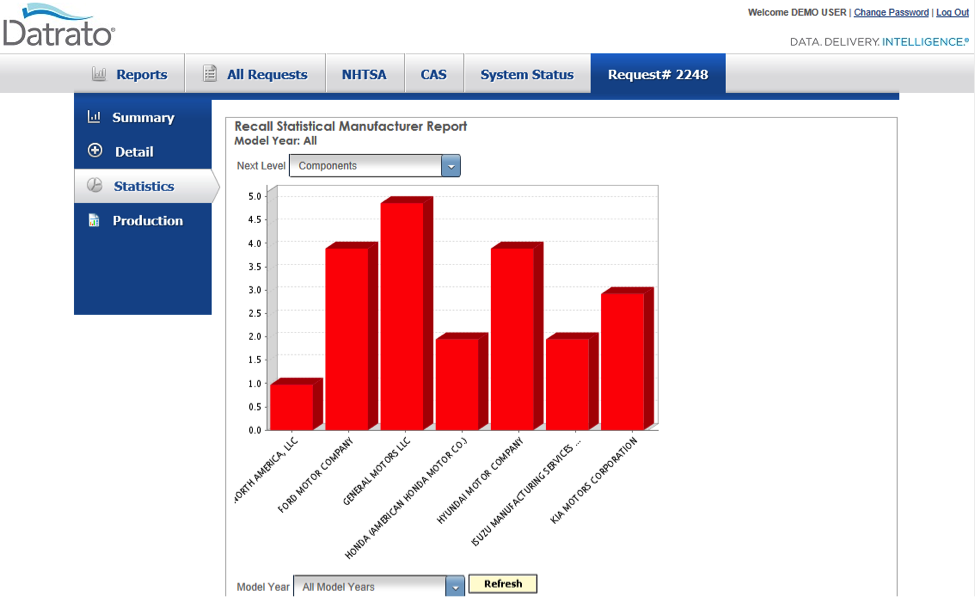
Recalls vs. Manufacturer
- Drill down to component, make, model, and finally to a detailed report.
- Similar reports for Investigations and Complaints.
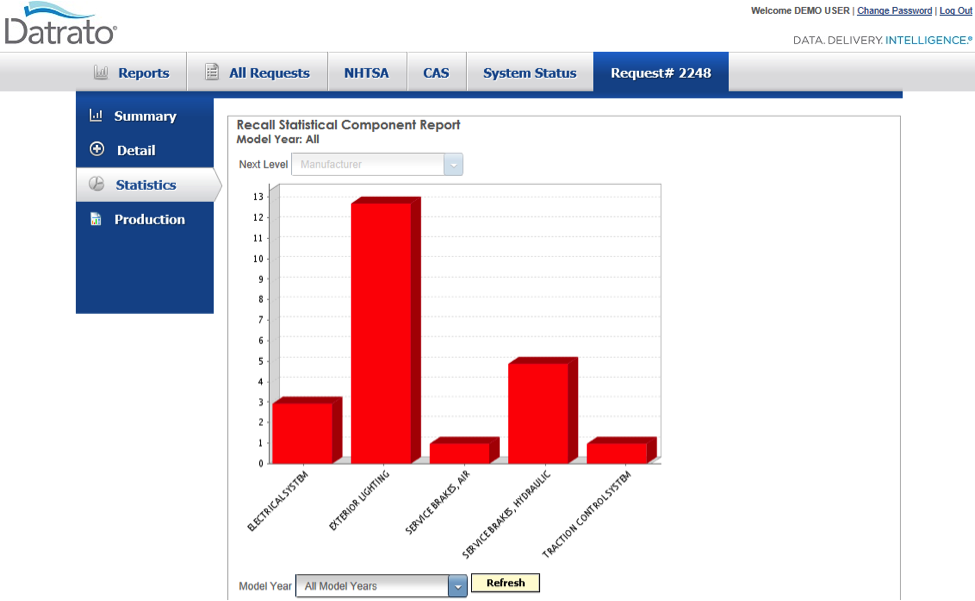
Recalls vs. Components
- Drill down to manufacturer, make, model, and finally to a detailed report.
- Similar reports for Investigations and Complaints.
Analysis
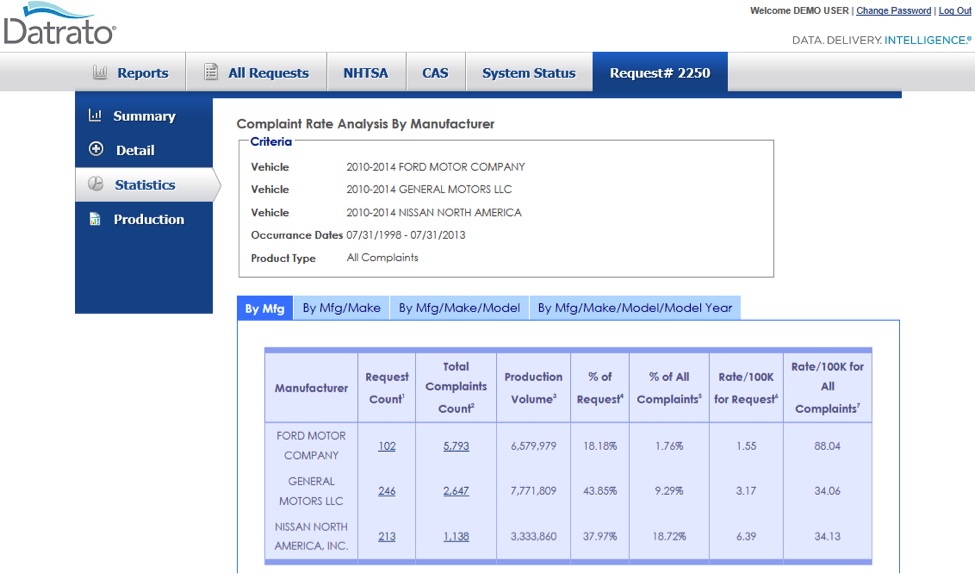
Complaint Rate Analysis
- Compare manufacturers by complaint rate per 100K.
- Available by manufacturer, make, model, and model year.
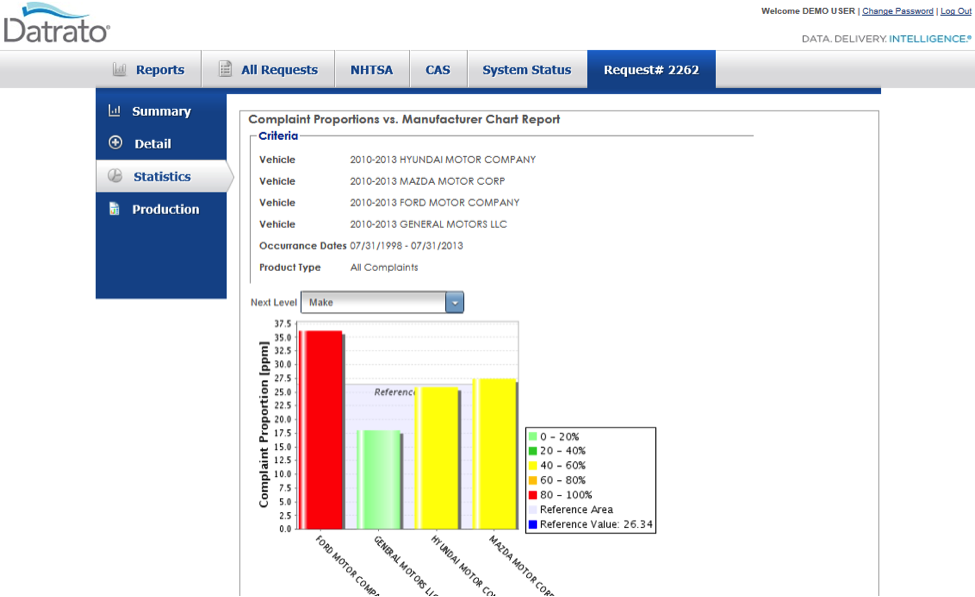
Proportion Analysis
- Tests on a probability basis whether complaint proportions across makes, models, or components are equivalent or significantly different.
- Run it for any component or across all components, by manufacturer, make, model, or model year.